
Posted on June 22, 2020
NotesActual Crowd Size at TulsaI intended to post this before the actual event but didn’t get it finished in time. As we know now, the crowds were far less than anticipated but still enough that the risk of a big jump in cases still exists.
You also have the option of using eWallets such as Skrill, PayPal, and Neteller. Another convenient deposit option for Planet 7 is Bitcoin. Bonus spins, on the other hand, will simply be a set amount of bonus spins or rounds on certain games that are provided free subject to certain wagering requirements BestIrishCasino. If you are attending a function that finishes late at The Crown Complex, that’s ok, we will pick you up and safely transport you home regardless of time.
Sources of State DataData for the states discussed and various countries mentioned here is taken from online resources.1
Contents
Summary
First, I look at two US states, Florida and South Carolina, which showed dramatic increases in cases starting approximately 6 weeks after starting to open up in in late April.
Now, with the Trump rally in Tulsa, we saw the largest gathering in the US since tings started to shut down. Furthermore, the state of Oklahoma (and Tulsa in particular) is showing very high and increasing occurrences of new cases.
Based on the actual attendance at the rally, projections are made of the number of attendees likely to become infected and the impact they might have on the area when these infected people return home and spread the disease to others. A simplified projection based on attendees all coming from Oklahoma and the current spread of the disease in that state suggests that infections attributable to the rally will lead to over 20,000 new cases in the next 6 weeks.
Some Definitions
Incubation Period
I will use this term loosely to define the length of time from a person becoming infected to becoming contagious. It is widely accepted that the time from infections to exhibiting symptoms is from 5 to 6 days. However. people can be contagious as much as 3 days before exhibiting symptoms.2 With this in mind we will use a conservative figure of 5 days in what follows.
Reproduction Ratios R0 and Rt
The reproduction ratio for a disease is the number of people who will be infected by a single infected person. It is usually referred to as R0. As a simple example, with R0= 2 and an incubation period of 5 days, one would expect a single infected person to cause 2 additional cases after 5 days each of whom would infect 2 others creating 4 more cases another 5 days later and so on. With this in mind a value of R0 of less than 1 means the disease will eventually die out while above 1 means it will grow.
Some writers use R0 to represent the basic reproduction ratio of the virus and Rt to represent the “effective” reproduction ratio. With these definitions, R0 is the ratio that would occur in a population that hasn’t been exposed to the disease (usually said to fall between 2 and 2.5) while Rt is the reproduction ratio at a particular time and particularly location.3 For coronavirus, the “basic value of is between 2 and 2.5.
Depending on factors like social distancing measure and so called “herd immunity” (i.e. a high percentage of people already infected and hence immune. For example, Rt in US states ranges from 0.69 in Massachusetts to 1.6 in Hawaii4
Difference between Reproduction Ratio and Exponential Growth
Ignore this note if you don’t care about the math.
Exponential growth with a fixed exponent means that the total number of cases increases by a fixed percentage each interval.5 A fixed value of Rt on the other hand means that the number of cases per interval (daily, weekly or whatever) increases by a fixed amount. In other words, Rt has to increase from interval to interval to maintain exponential growth
The Florida and South Carolina Examples
Before looking at the possible impact of Trump’s Tulsa rally tonight, it is instructive to look at what happened in Florida and South Carolina since they started to reopen in mid to late April.
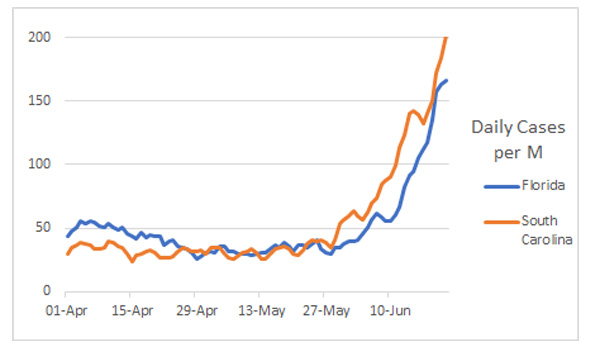
Figure 1. Daily Cases per Million Population (5 day rolling average) for the Florida and South Carolina.
In looking at the data in the Figure, keep in mind that South Carolina started lifting lockdown measure on May 4 and Florida also started a phased reopening on the same date (all but Broward, Miami-Dade and Palm Beach counties which opened 2 weeks later).
As seen in the Figure, daily cases in both states started a significant rise about around the start of June (4 weeks after the reopening).In fact, the trajectory of daily cases looks remarkably similar for both states with the daily growth of total cases is now approaching 4% (i.e doubling every 18 days). Worse, growth appears to be increasing. For example, on June 20, both states had there highest number of new cases yet represented a 4.6% increase in total cases in Florida and 5% in South Carolina.
Note also, that both states showed started to show a slight decline in daily cases starting around mid April before they started to open up – Florida with about 1000 cases per day and South Carolina around 180. However, daily rates on June 22 were almost 4 times as high as that “peak” in Florida and almost 6 times as many in South Carolina.
With the above in mind, it’s interesting to note that there was still thinking as late as May 28 that there wouldn’t be a serious spike arising from opening up.6 In actual fact, what has happened in these two (and other) states was entirely predictable as the experts say it will take five to six of weeks for for real growth to occur once it starts7 which is exactly how long it took in Florida and South Carolina.
As a final comment, on the Florida and South Carolina, the daily number of cases per capita on June 22 (rapproaching 200 cases per day per Million population) is higher than the level reached by Spain at its peak in late March and more than twice as high as the peak reached by the US in mid April.
The Current Situation in Oklahoma and Tulsa
Here are some highlights of the current situation in Oklahoma and Tulsa
- As of June 20, Oklahoma has experienced a total of approximately 10,000 cases (approximately 2500 per million population. This is certainly not a low rate roughly the same as Canada and France, half that of Spain and 40% of the US which leads the world among countries with a population over 4 million.
- Unlike the countries mentioned above, the growth rate is high – 22% in the last 7 days alone.
- In Tulsa County, the situation is even worse – 2200 total cases on July 20 – approximately 3700 per million population which is almost 50% higher than the state as a whole. Furthermore, the growth in cases over the last week was almost 50% which is extremely high. In fact, it is 20% higher than the growth rate in Brazil (generally regarded as having the worst situation in the world) and, if continued would result on a doubling of the total number of cases in just 10 days.8
A late reminder that Tulsa is a particularly dangerous place for such a gathering is the report that six Trump advance team members tested positive on the day of the event.9 and an additional 2 staff members tested positive 2 days later.10 As they had been in Tulsa for a number of days, it is likely they were infected there.
What will be Outcome of Gathering?
The following estimates the number of people likely to have been infected at the rally. Clearly, these estimates will require some simplifying assumptions (for instance, that all attendees came for Oklahoma); so the estimates are going to be very rough.
- As a starting point, we need to estimate the number of infected people who were at the rally. Assuming they all came from Oklahoma, there are currently approximately 3,000 known active cases in the state and, most likely, an equal number of asymptomatic carriers (The rough mid point between etimates of 20% to 80% who are asymptomatic11) for a total of 1.5 per 1000 persons in the state. The same calculation for Tulsa county leads to 2.8 carriers per 1000.
- Based on the above, we will assume that there were roughly 2.2 carriers per 1000 attendees at the rally or a total of 14 with the estimated attendance of 6200.
- It is generally accepted that about 20% of those will be so called “superspreaders” – highly contagious people who can infect many others at a large gathering. So, it is likely that at least 3 attendees at the rally were superspreaders.12
- How many people might each of these people infected? Probably the closest documented case is a choir practice in the state of Washington where one infected person infected 52 of 61 attendees13. They were together for 21/2 hours over have of it spent singing. The conditions at the rally would have been similar – people close together and voices often raised. So it’s not unreasonable to assume that each superspreader would have infected 50 people or more. In fact more seems likely as the single spreader in the choir infected 83% of the people who were nearby.
So what happens when the estimated 150 people infected by the superspreaders return home after the event?
If we make three assumptions:
- All attendees returned to homes in Oklahoma and
- The incubation period (i.e. the time from infection to becoming contagious) of the disease is five days.
- Rt for Oklahoma going forward is 1.5 (1.47 on June 19 and rising)
Five days after the rally 225 people will have been infected by these 150 attendees and they in turn will have caused 328 infections in the next five days. As this continues, a total of approximately 22000 new cases will have been created in 6 weeks as a direct consequence of the rally. To put this in perspective, this is approximately twice the total number of cases in Oklahoma today and the daily increase in new cases in the sixth week would more than 4 times as high as the current number of new cases per day. This course would be in addition to new cases created by people currently infected in the state.
Could the effect be less? Given the conditions, the estimate of superspreaders infecting 50 people seems conservative if anything. However, even one less superspreader would lead significantly less total cases in the end and a portion of the rally attenders probably came for outside Oklahoma where R0 is lower. If we assume for example, 2 superspreaders at the rally and R0 of 1.3, the number of new cases created would fall to approximately 14000.
On the other hand it could be much worse. As already mentioned, the number of people infected by each superspreader would more likely be more than 50. So for example, if we assume that there were 3 superspreaders infecting 75 attendees each, the total number of new cases to approximately 50,000.
On to Arizona and Denials
A rally is planned on June 23 in a 3000 seat church in Phoenix.14 While theoretically involving fewer people, it could easily be more crowded. Furthermore, the situation in Arizona is significantly worse than in Oklahoma: Approximately 7500 cases per million population, with an increase of 40% over the last week which is three times the number of cases per capita in Oklahoma and twice the growth rate.
Maybe disaster will be averted! Bizarrely, the church hosting the event claims to have access to technology that will “wipe out virtually 100% of COVID-19 molecules in air”.15
Sometime in the next few weeks, I expect to hear Trump and his supporters tout the fact that the spike due to the rallies didn’t happen, just like was done in late May in Florida and South Carolina. This could easily be true at that time. For example, assuming that my mean projection of 22000 new cases attributable to the rally after 6 weeks is correct, the daily number of new cases from this source after two weeks would be roughly 100 – roughly 20% of the number that would occur in the state if present trends continue (i.e. roughly 3% increase in total cases per day). This might be noted as an increase but it would be easy to argue other causes – including the favourite one of more testing
Again, if present trends continue in the state, cases would be added at a rate of approximately 700 per day after 4 weeks and 1200 per day after six weeks. Compare this to approximately 300 per day after 4 weeks and 1200 per day after 6 weeks attributable to rally attendees. Put simply, if this scenario plays out, the growth rate of total cases per day would have doubled from the current 3% to 6%.
Expect the following in the coming weeks:
- Research projects attempting to contact trace infected rally attendees as this first large (even though disappointingly small to the Trumpites) gathering presents an ideal “laboratory”.16
- Continuing debates on whether the Tulsa rally has caused a spike in Tulsa, Oklahoma and possibly neighbouring states. These will be particularly confusing if the effect of the rally is less than my “mean” projection suggests and it may fall to the research projects to provide definitive conclusions.
Undoubtedly the rallies and debates will continues. The fact that Trump will favour Republican or battleground states means that many of them will already experience high levels of infection – Florida, Texas, Wisconsin and Michigan are examples.
I’ll update this if things become clearer.
References
- WorldoMeter COVID-19 CORONAVIRUS PANDEMIC website and the Wikipedia COVID-19 pandemic webpages
- Coronavirus disease 2019 (COVID-19) Situation Report – 73, WHO website, April 6, 2020
- Rt: The number that can guide how societies ease coronavirus lockdowns, Quartz website, April 2, 2020
- See, for example, Rt Covid-19 website
- See my previous post
- See, for example, After reopening, Florida hasn’t seen a spike in coronavirus cases. Are we in the clear?, Tampa Bay Times, May 28, 2020
- See, for example, Virus spikes could emerge weeks after US economic reopenings, Medical Press website, May 28, 2020
- Data for Tulsa County taken from Tulsa Health Department Coronavirus Disease 2019 (COVID-19) website
- See, for example, Six members of Trump’s campaign team test positive for COVID-19, Reuters, June 20, 2020
- Two More Trump Staff Members Test Positive for Coronavirus After Tulsa Rally, New York Times, June 22. 2020
- As Many as 80 Percent of People with COVID-19 Aren’t Aware They Have the Virus, Healthline website, May 28, 2020
- A few superspreaders transmit the majority of coronavirus cases, The Conversation, June 6, 2020
- How a superspreader at choir practice sickened 52 people with COVID-19, Live Science, May 4, 2020
- After his Tulsa fizzle, Trump’s Arizona rally is a disaster waiting to happen, The Arizona Republic, June 22, 2020
- TTRUMP’S ARIZONA RALLY SITE CHURCH CLAIMS NEW TECH KILLS COVID … Most of It, Anyway, COVID, TMZ website, June 22, 2020
- Trump Rally Hands Scientists a Test Case for Superspreader Event, Bloomberg website, June 18, 2020